
Discover more from AutoMarketplace
🔓😮⚡ Uber & Lyft NYC Utilization Rates Plunge In Seasonally Slow January
January is known to be a seasonally slow month, but drop to over 4% below 53% NYC TLC minimum driver pay UR floor is HIGHLY concerning re. driver earnings, longer waitlists & potential lockouts
The industrywide utilization rate (UR) is a key metric used in TLC’s driver minimum pay calculation for high-volume bases (currently only Uber and Lyft)
UR is how busy a driver is kept while logged into either Uber or Lyft in NYC
January industrywide UR dropped 5.2% to 48.7% (month-over-month)
January is known to be a seasonally slow month, but UR that is a 4.3% below the 53% floor in the NYC minimum driver pay formula is concerning, implying lower driver earnings, longer waitlists, and increasing risk of lockouts returning
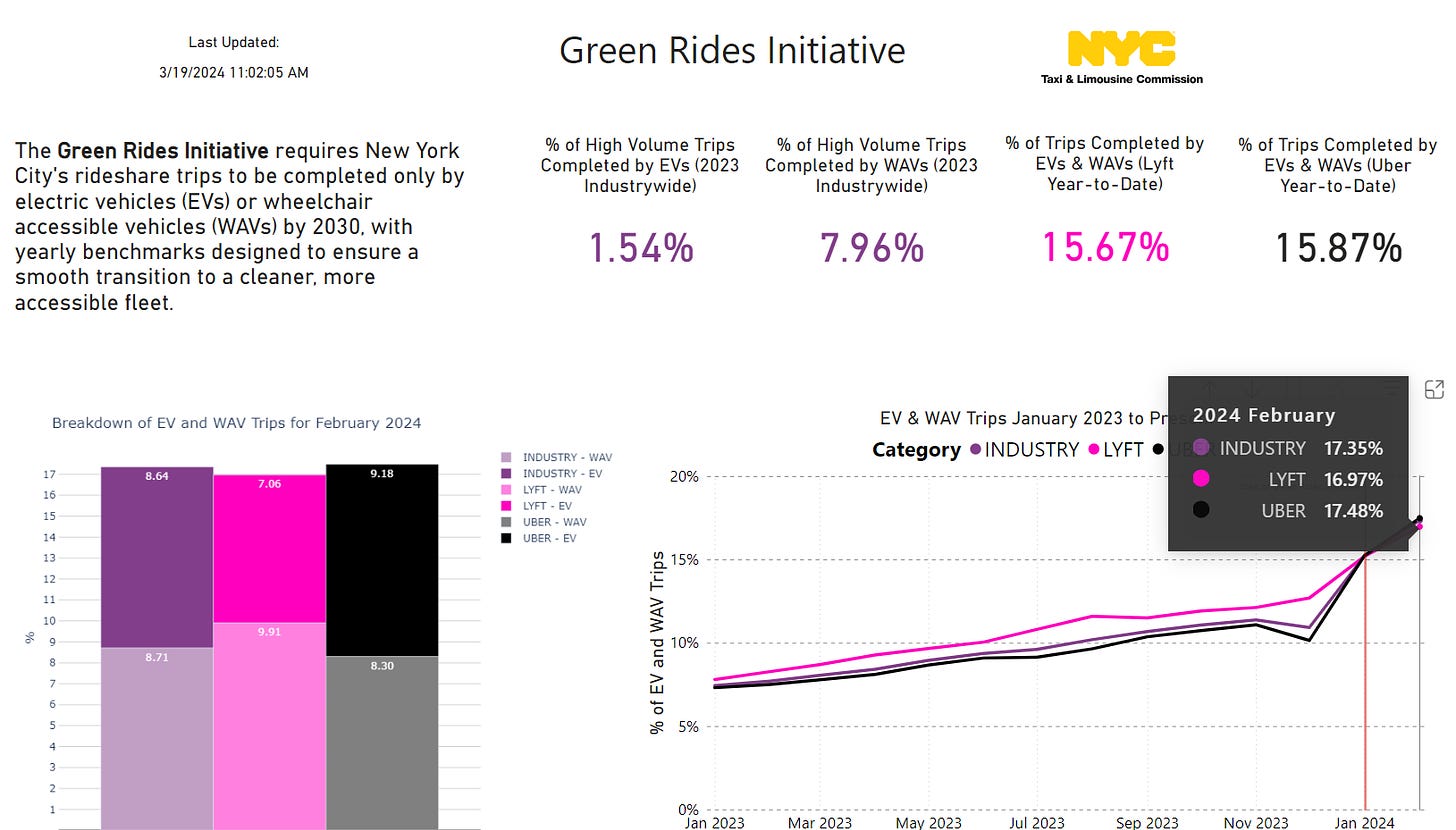
Green Rides Initiative tab reveals record 17.4% of all Uber & Lyft NYC trips were done in either wheelchair accessible vehicles (WAV) or electric vehicles (EVs)
This is our six monthly update on NYC TLC utilization rates (UR). UR can simply be described as how busy an Uber / Lyft NYC driver is kept. It is a key metric for TLC-licensed drivers to track because it tells you the probability of “lockouts” returning, the appropriateness of NYC for-hire vehicle (TLC Plate) supply vs. trip demand and how much time it might take a prospective app driver to get off NYC waitlists.
The lower UR is, especially anything that risks breaking the 53% driver minimum pay-related UR floor, the higher probability of lockouts and the longer new drivers will have to wait to get access to Uber and Lyft in NYC. For example, we know of some drivers who have been waiting more than four months to get off the waitlists.
😮 Seasonally Slow Or Something More
As Josh Gold, a senior policy director for Uber, implied in a public hearing last March, and as most NYC TLC drivers and industry participants subjectively know, January is typically a slow month for work.
That being said, the latest UR figures are still highly concerning.
“…I believe there was a couple months in 2020, probably in January, which is a slow month, it’s below 56%…”
- Josh Gold, Senior Director of Public Affairs at Uber
Since there is not a like-for-like January 2023 benchmark, it’s best to summarize the latest TLC Factbook data as follows:
⚫ Uber UR dropped to 50.2% in January 2024. This is the lowest reported UR for the company since the TLC began reporting UR stats in April 2023
🟣 Lyft UR dropped to 44.7% in January 2024. This is the second lowest reported UR (August 2023 was 43.8%) for the company since April 2023
📉 Industrywide UR dropped to 48.7% in January 2024. This is the lowest reported UR for the industry since the TLC began reporting this data
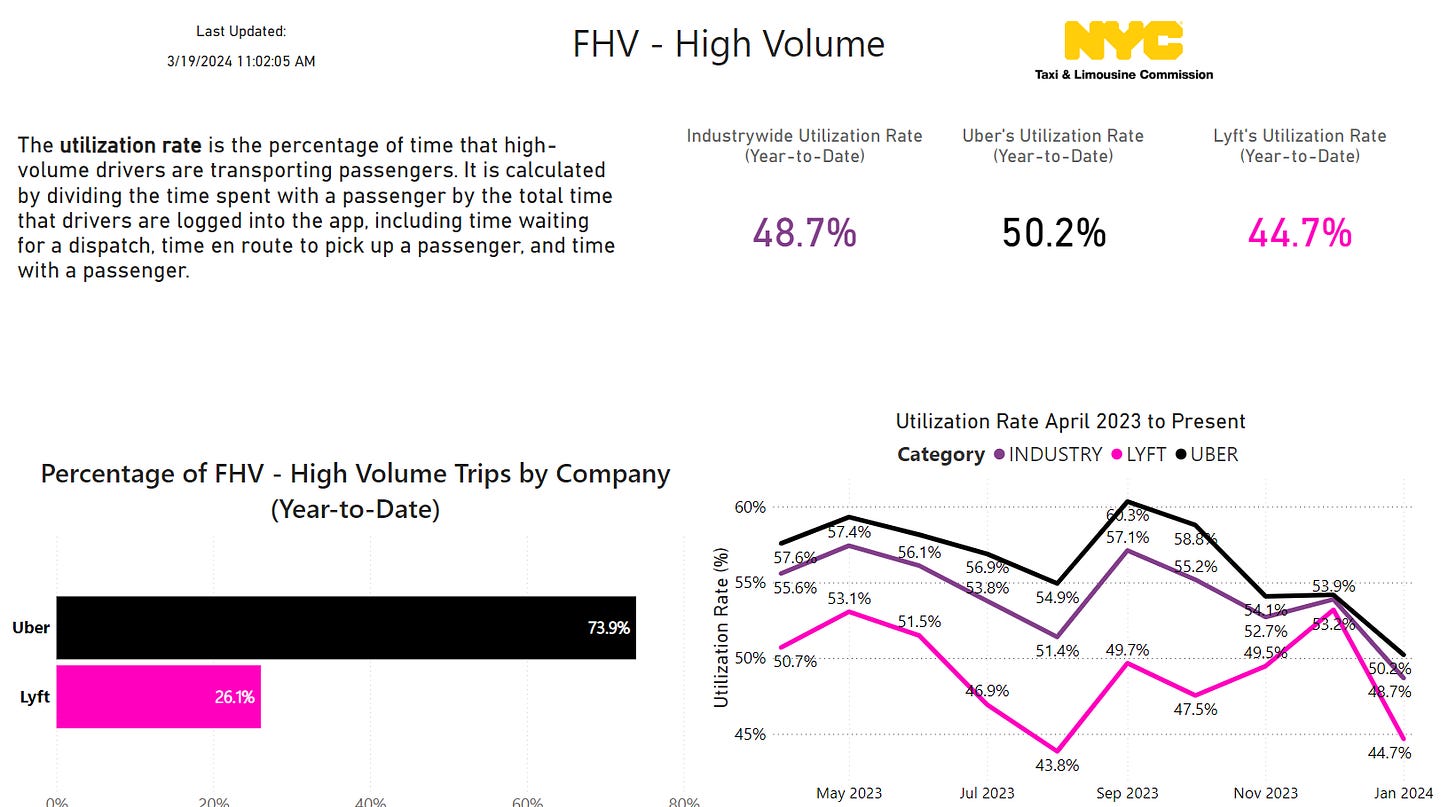
Remember, industrywide UR is measured on a calendar year basis, so there might be some months that can drag the average lower, but are offset by other months that are busier. That being said, a 🙄 48.7% industrywide UR seems dangerously below the 53% UR floor included in the TLC’s minimum driver pay formula. A sub-53% calendar year UR would be disastrous for both Uber and Lyft NYC operations.
To be simple, Uber and Lyft could be forced to “lockout” some currently active drivers if they begin to observe that they (Uber + Lyft) cannot comfortably sustain above a 53% industrywide UR with their current active NYC TLC driver base. There are already early warning signs with reports of TLC drivers waiting more than 4 months (if not longer) to get off the NYC rideshare app waitlists.
Article continues after advertisement
⚡♿ Green Rides Record
In February 2024 a record 17.35% of all Uber and Lyft NYC trips were done in either a wheelchair accessible vehicle (♿ WAV) or electric vehicle (⚡ EV). With the addition of ~10,000 additional EVs to the NYC for-hire vehicle (FHV) fleet over the last several months, this figure also matches the latest FHV supply data.
Our analysis, as of February 6, 2024, indicated that of the ~108,000 active non-taxi TLC-plated vehicles, 6.7% were WAVs and 8.9% were EVs. Since there are no fully electric WAVs (right now), we can reasonably assume over 15% of the entire non-taxi medallion TLC fleet is either an EV or WAV. Fully electric NYC FHV supply also likely increased throughout February as well.
🚕 Yellow Cab Recovery?
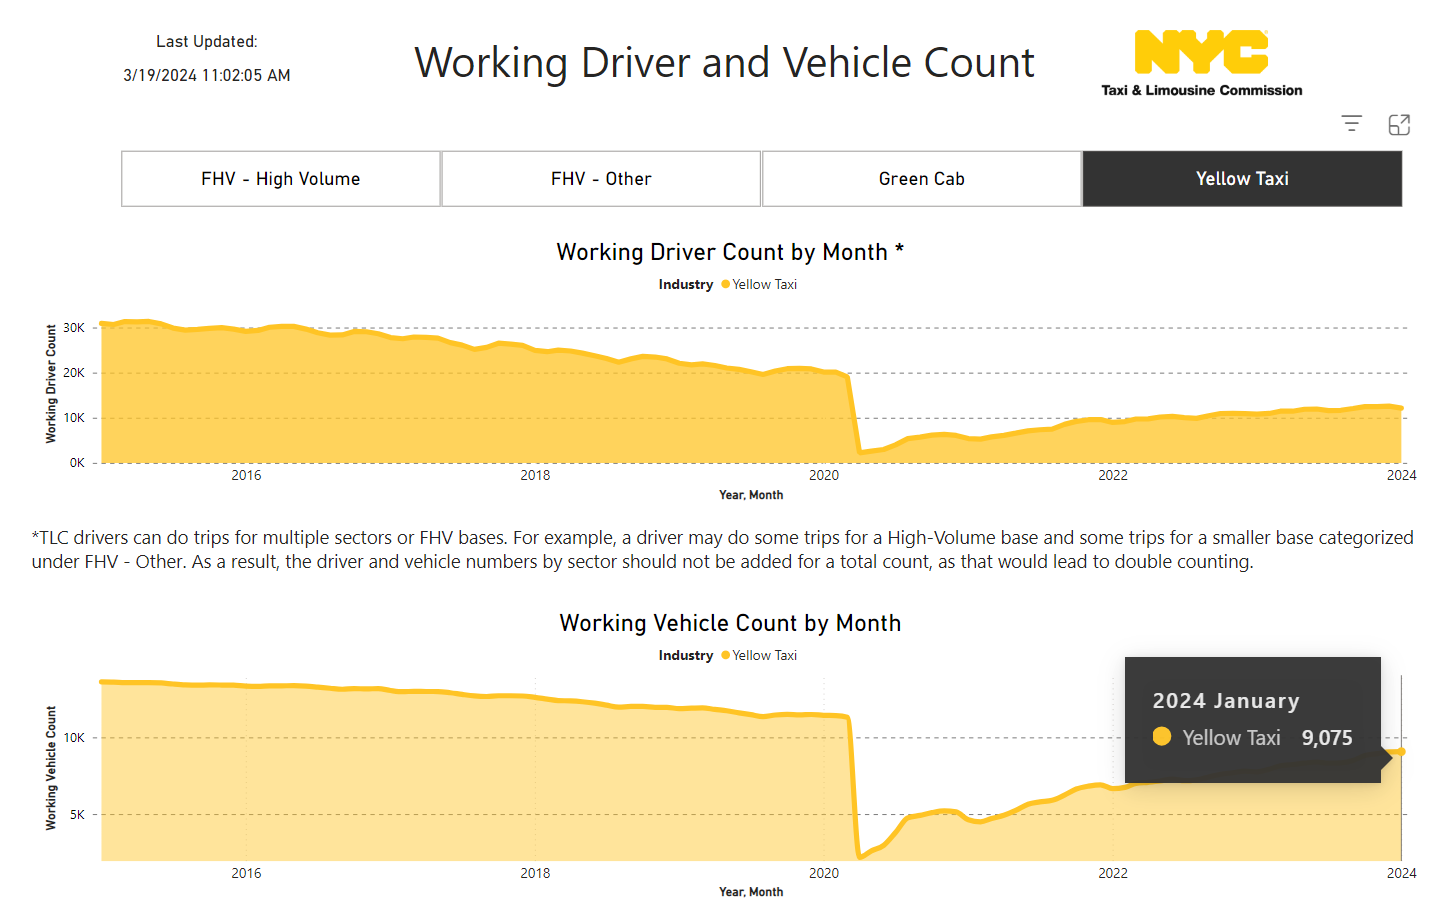
The yellow cab and taxi medallion story continues to show promising, albeit slow, signs of recovery. For the first time since the pandemic there were over 9,070 active yellow cabs (13,587 total taxi medallions exist) on City streets! However, even with more active medallion taxis and drivers, yellow cab trip volumes remain stuck at ~50% of pre-pandemic levels.
Perhaps as Uber and Lyft in NYC get harder to access, more TLC-licensed drivers will start driving yellow cabs? 🤔 Maybe even purchasing taxi medallions? 🤔🤔 It’s something we’ll actively track and report on.
Why Is There A Utilization Rate?
For those who might want to understand the background to why a utilization rate (UR) exists we’ve copy-pasted a slightly revised explanation from another article we published last year.
Let’s briefly overview the following:
What is the utilization rate?
Why did the TLC create this measurement?
Why would it cause Uber (or Lyft) to introduce “lockouts”?
Utilization Rate, Per Mile, Per Minute
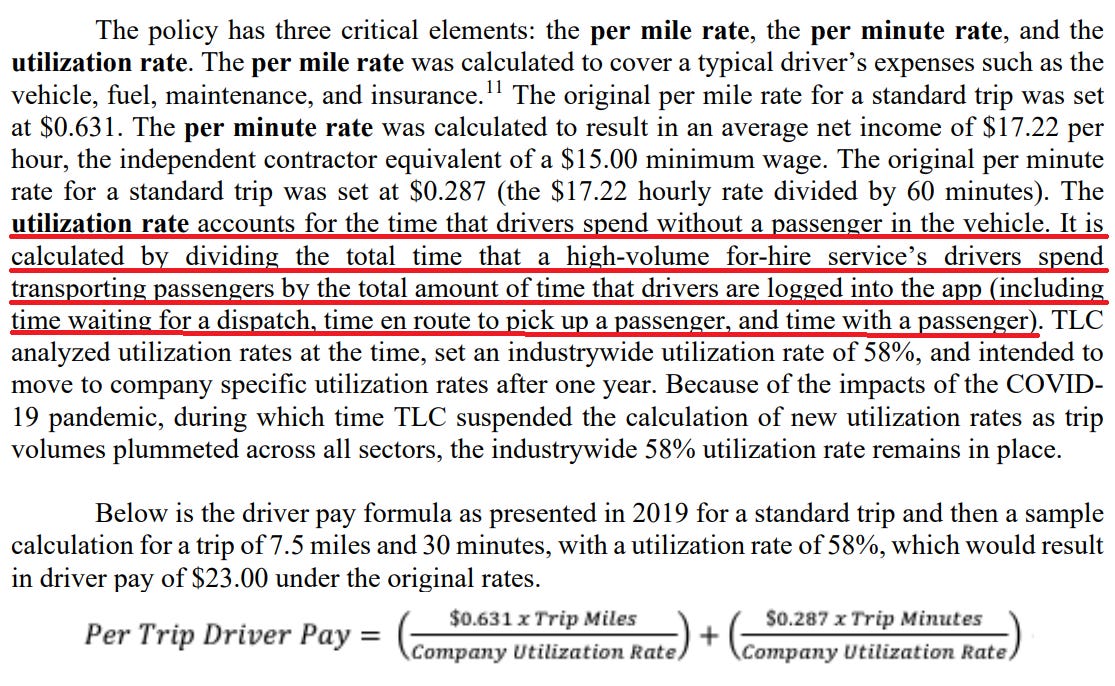
There are three key inputs the TLC uses when calculating the TLC Driver Minimum Pay Standard for high-volume for-hire service bases (Note: this is currently only applicable to Uber & Lyft):
Per Mile Rate: Compensation for distance travelled. Estimates driver expenses, such as fuel, maintenance & insurance
Per Minute Rate: Compensation for time. Solves for “net wage” that’s benchmarked to New York State & City gross minimum wage rules
Utilization Rate: Essentially how busy a driver is kept. Time with a passenger(s) ➗ total hours “online” waiting for / travelling to a trip plus time with passenger(s)

The utilization rate (UR), the TLC would likely argue, is a metric the regulator created to ensure the industry consisted of full-time & highly utilized (or busy) commercially licensed drivers vs. part-time “rideshare” drivers. Given congestion concerns and how lucrative (& regulated) NYC’s for-hire transportation market had historically been, the TLC likely wanted to “re-professionalize” the industry.
Remember, the TLC & City government (we hope 🤷) want a for-hire transport market consisting of mostly full-time drivers that earn a protected NYC middle class wage through ensuring trip demand and driver supply are kept in healthy equilibrium. The ‘TLC Plate Cap’, limiting the number of NYC for-hire vehicles, was also created in the same vein as the utilization rate.
Both are mechanisms to protect driver wages and also limit congestion. For example, capping how many vehicles (supply) can service NYC for-hire trips (demand), will likely lead to higher driver wages.
So, how does this relate to an Uber driver “lockout”?
Note: Lyft also had “lockouts”, so the Uber example below will also be applicable to Lyft, which also limited NYC TLC drivers access to their app.
Uber NYC Planner (“Lockouts”)
The genesis of the infamous NYC Uber Planner can be traced back to minimum pay rules & formula mentioned above. After the minimum pay laws passed in late 2018, high-volume for-hire services (Uber, Lyft and at that time Via, Juno also) needed to ensure that independently contracted TLC drivers were earning the equivalent of ~$23.00 per hour gross (2020) and now ~$27.70 per hour gross while logged into an HV app.
The reason why we italicized “while logged into an HV app”, underscores why Uber (and Lyft in a similar manner) created the Planner (lockouts) in NYC.
⭐ What Uber (& Lyft) need to solve for is ensuring logged-in NYC TLC drivers are kept as busy as possible (high UR), so Uber (or Lyft) didn’t have to come out-of-pocket or raise fares to ensure the minimum pay thresholds were being satisfied. ⭐
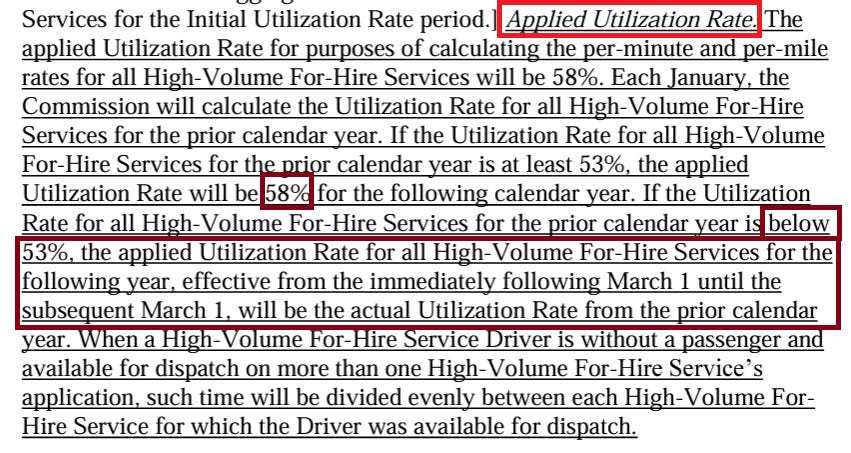
To be simple, let’s say a driver was actively logged into the Uber NYC app for an hour and only got 1 trip that earned them gross $15, Uber would need to come out of pocket ~$12.70 (using 2024 figures), to ensure the minimum driver pay standard was met, or face a fine. In addition, as noted above, if the calendar year industry utilization rate falls below the 53% industrywide floor, Uber and Lyft will have to use the actual UR, not 58%.
⭐ The higher the UR (denominator), the better for Uber & Lyft. If the industry-wide UR falls below the 53% floor, it has a significant financial impact, so Uber/Lyft would institute lockouts to prevent that from happening. ⭐
Example with 58% UR denominator = [($16) / (.58)] = $27.59
Example with 53% (ACTUAL) UR denominator = [($16) / (.53)] = $30.19
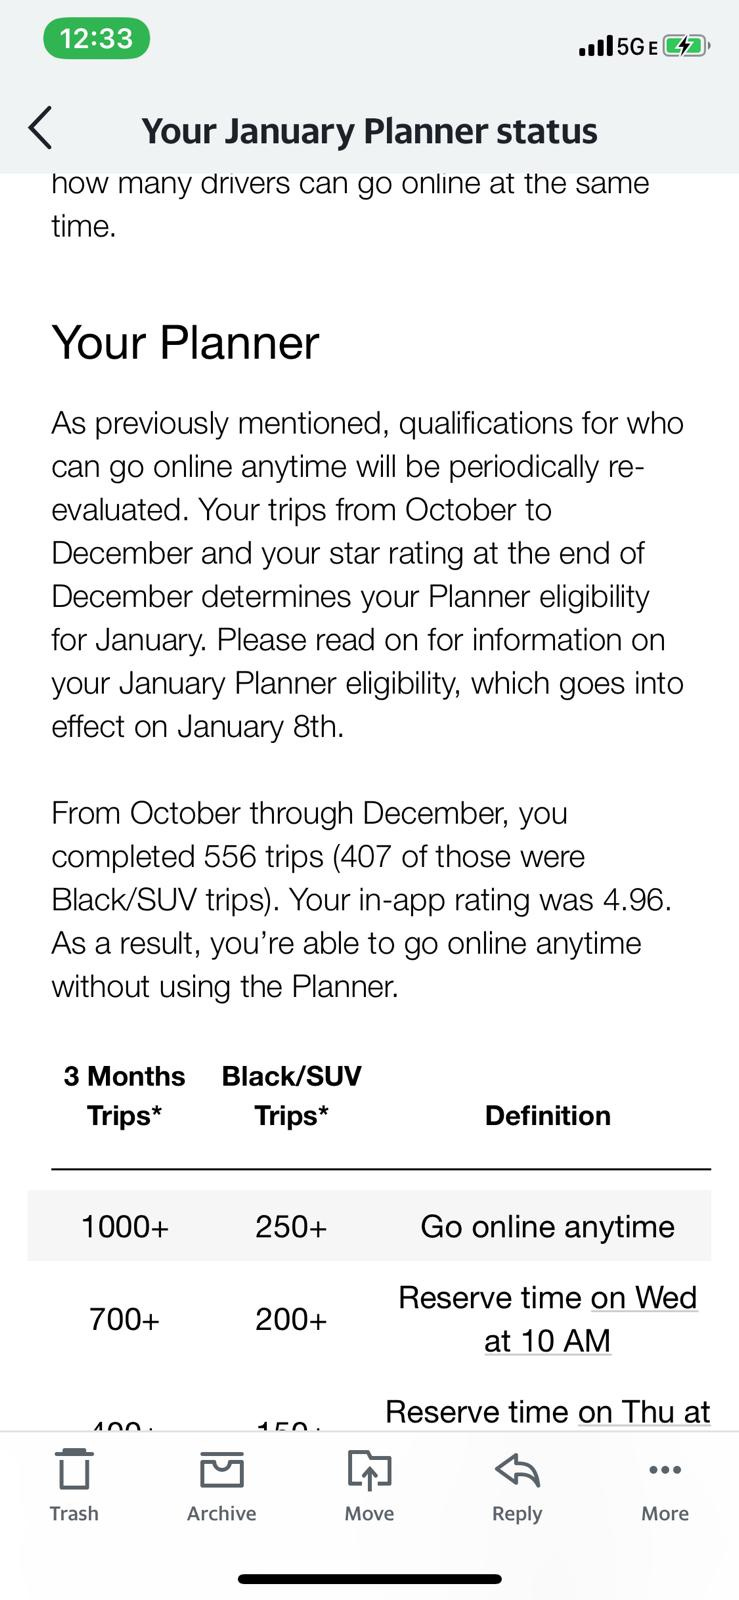
Therefore, the system Uber (and Lyft in a similar way) came up with to ensure they wouldn’t be coming out of pocket on wages or need to increase fares was lockouts. The Uber Planner, as can be seen in image below, prioritized drivers based on:
Number of trips completed
Rating
Cancellation rate
(Note: Uber Black thresholds were lower because the average earnings per Black trip is much higher , so the wage standard is more easily met)
Uber likely wanted to ensure their core NYC TLC driver base was highly-rated, full-time drivers who often accepted trip requests vs. a mix of part-timers and full-timers. Uber could better utilize this driver base and in turn these drivers would likely benefit from increased and more stable/predictable earnings »» in turn making it easier for the company to retain them.
However, the original Uber/Lyft promise of flexibility & working whenever you wanted was redefined in NYC, which to begin with, had always been a unique “rideshare” market, defined by existing taxi regulations and full-time commercially licensed drivers. The COVID pandemic saw the TLC abandon utilization rate requirements for several reasons, notably a well publicized driver shortage and a collapse in trip demand. However, as TLC drivers came back and trip demand rebounded, the UR rules were reinstituted.


